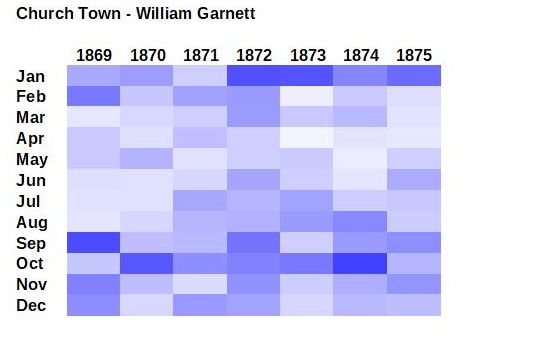
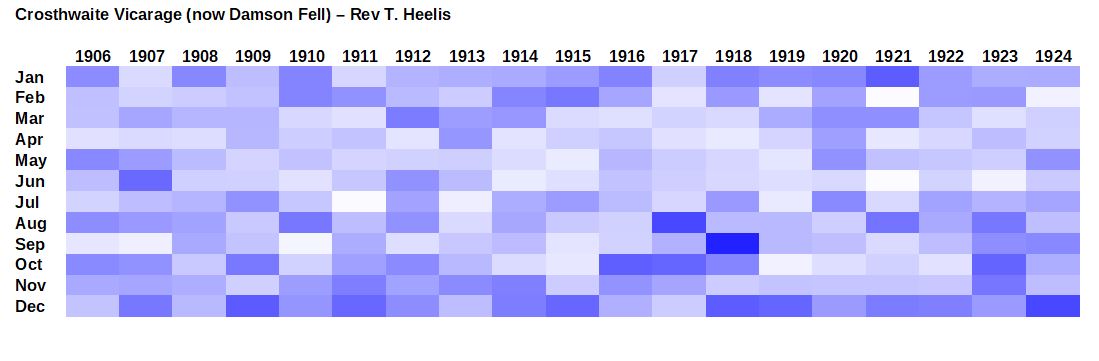
One of my Lockdown projects has been to research the historical rainfall records for the local area. For Crosthwaite, There are three sets of monthly readings - by William Garnett at Church Town (the Eastern end of Crosthwaite) between 1869 and 1875, by the Rev. Thomas Heelis (Beatrix Potter’s brother-in-law and vicar at St. Mary’s) at the old vicarage (now Damson Fell) between 1906 and 1924 and by Norman Wilson at Low Fell (to the west of Crosthwaite) between 1937 and 1947. I now have Rodney Sale's records between 1993 and 2004. In addition there is on-going rainfall data kindly supplied by Mike Fleetwood of Brigsteer.
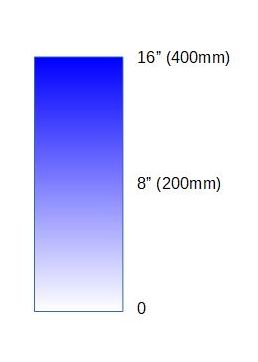
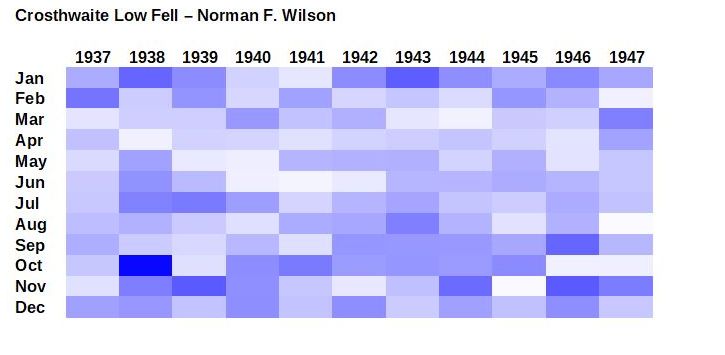
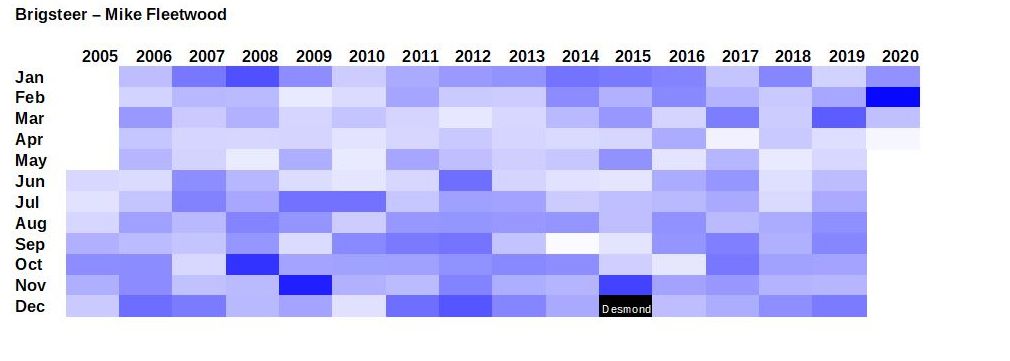
The diagrams illustrate the monthly rainfall figures, with an increasing rainfall denoted by a darker shade of blue, as shown on the scale. The graph shows the average monthly figures. It is interesting to note that the three sets of Crosthwaite figures are surprisingly consistent, but the Brigsteer figures are about 10% higher. Until I get recent Crosthwaite rainfall data, I do not know if this is typical, or if rainfall generally is higher now.
April is the driest month, and January the wettest. No surprises there!
Charles Walmsley


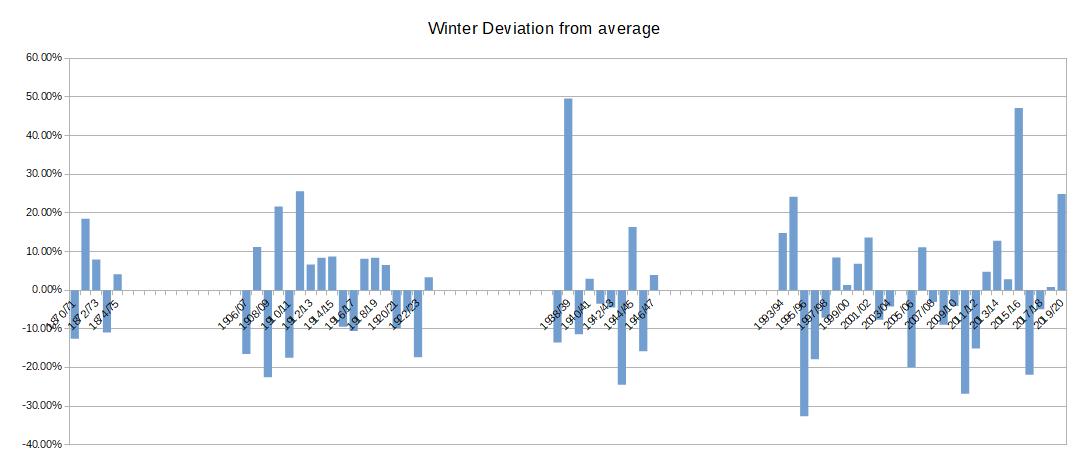
We are all only too well aware that climate change is very real, so it is interesting to search for evidence of it in the historical Crosthwaite rainfall records
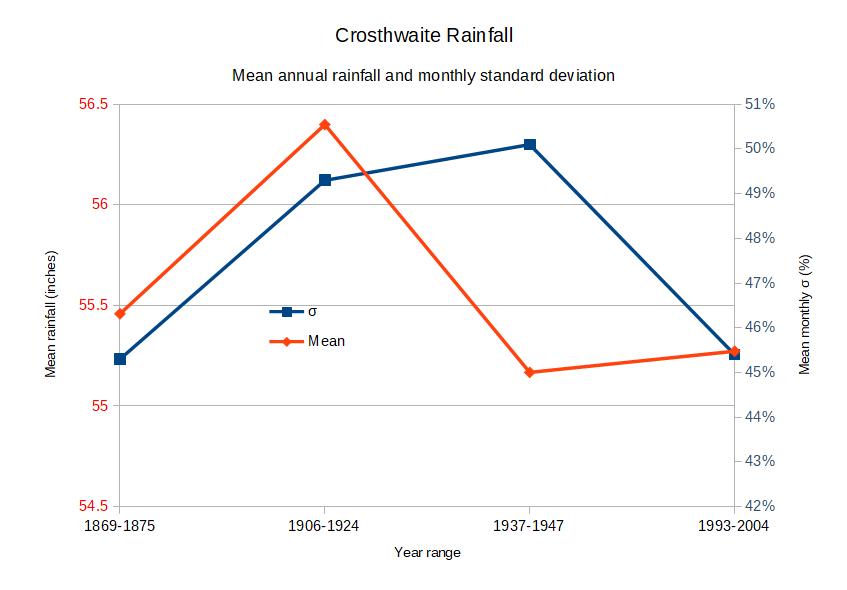
Curiously, the average Crosthwaite rainfall (it is not valid to use Brigsteer data for these purposes) has not changed significantly since 1869, so let's look instead at the variability between wet and dry months. Is there a greater spread? Surprisingly, the answer is no! See the graph on the right. The standard deviation is consistently just below 50%. If any readers have suggestions on where to search for evidence of climate change in the rainfall records, please let us know.
Click on an image to see a higher resolution popup
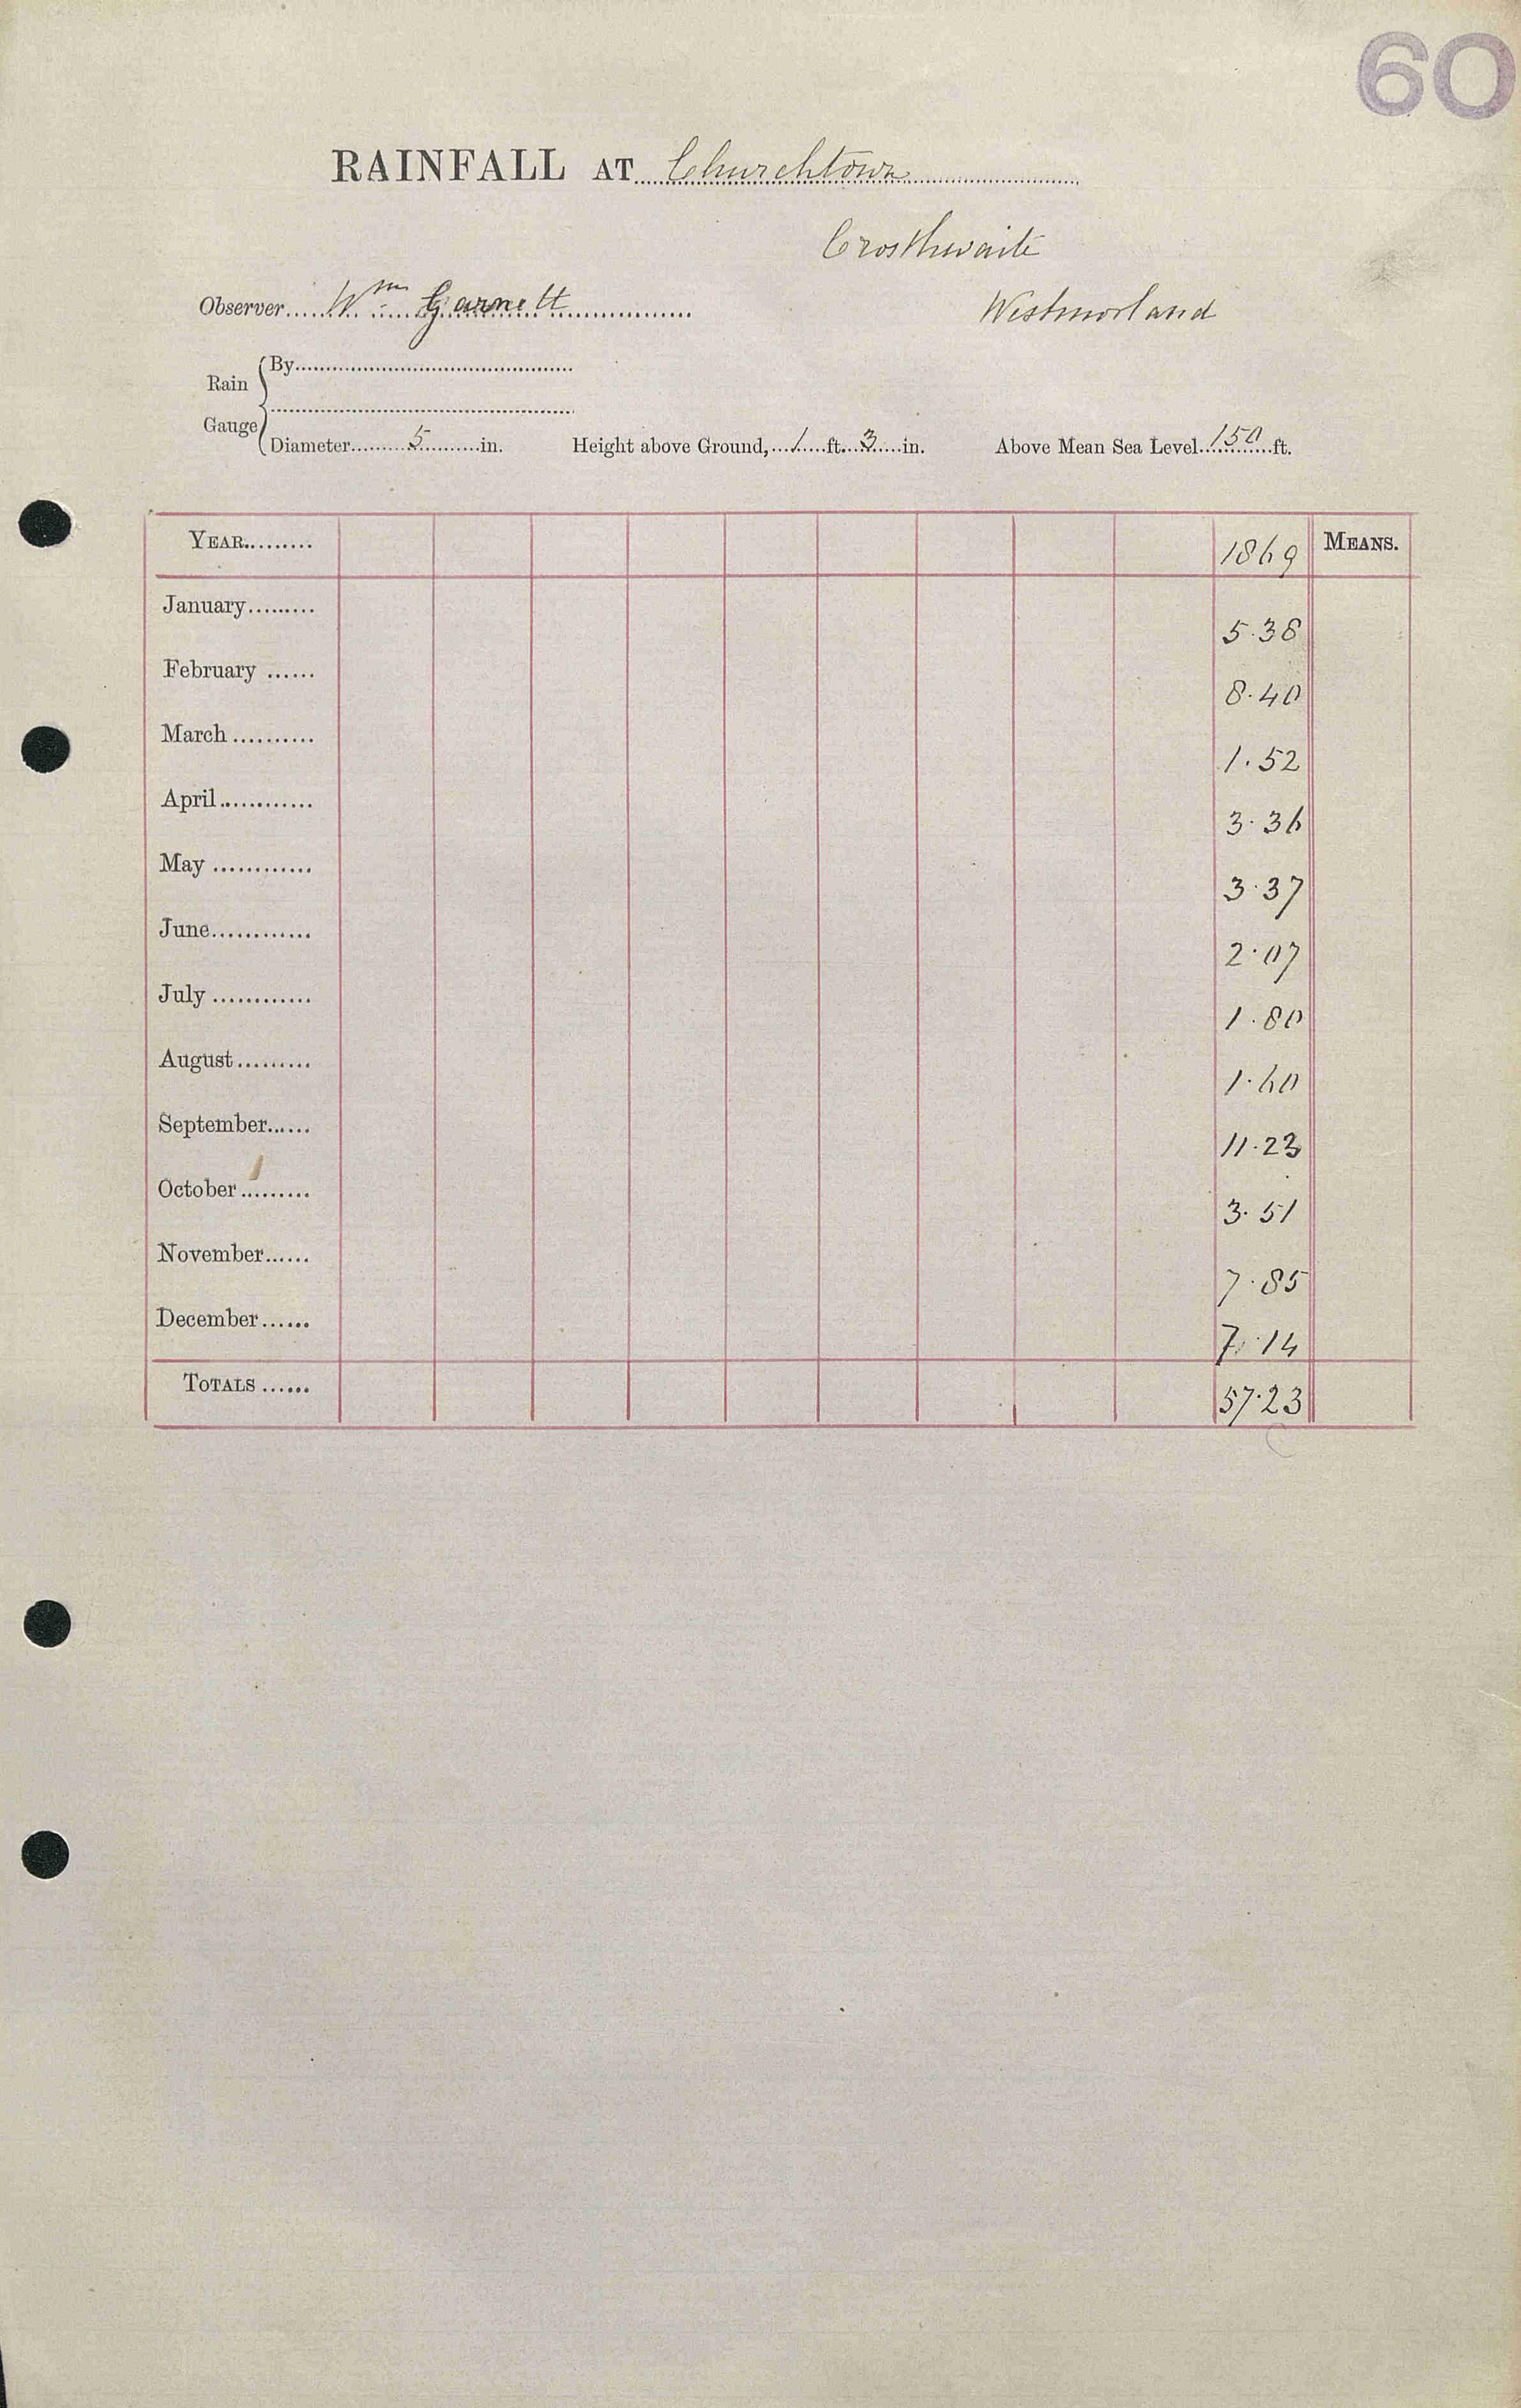
1 Churchtown 1869

2 Churchtown 1870-75
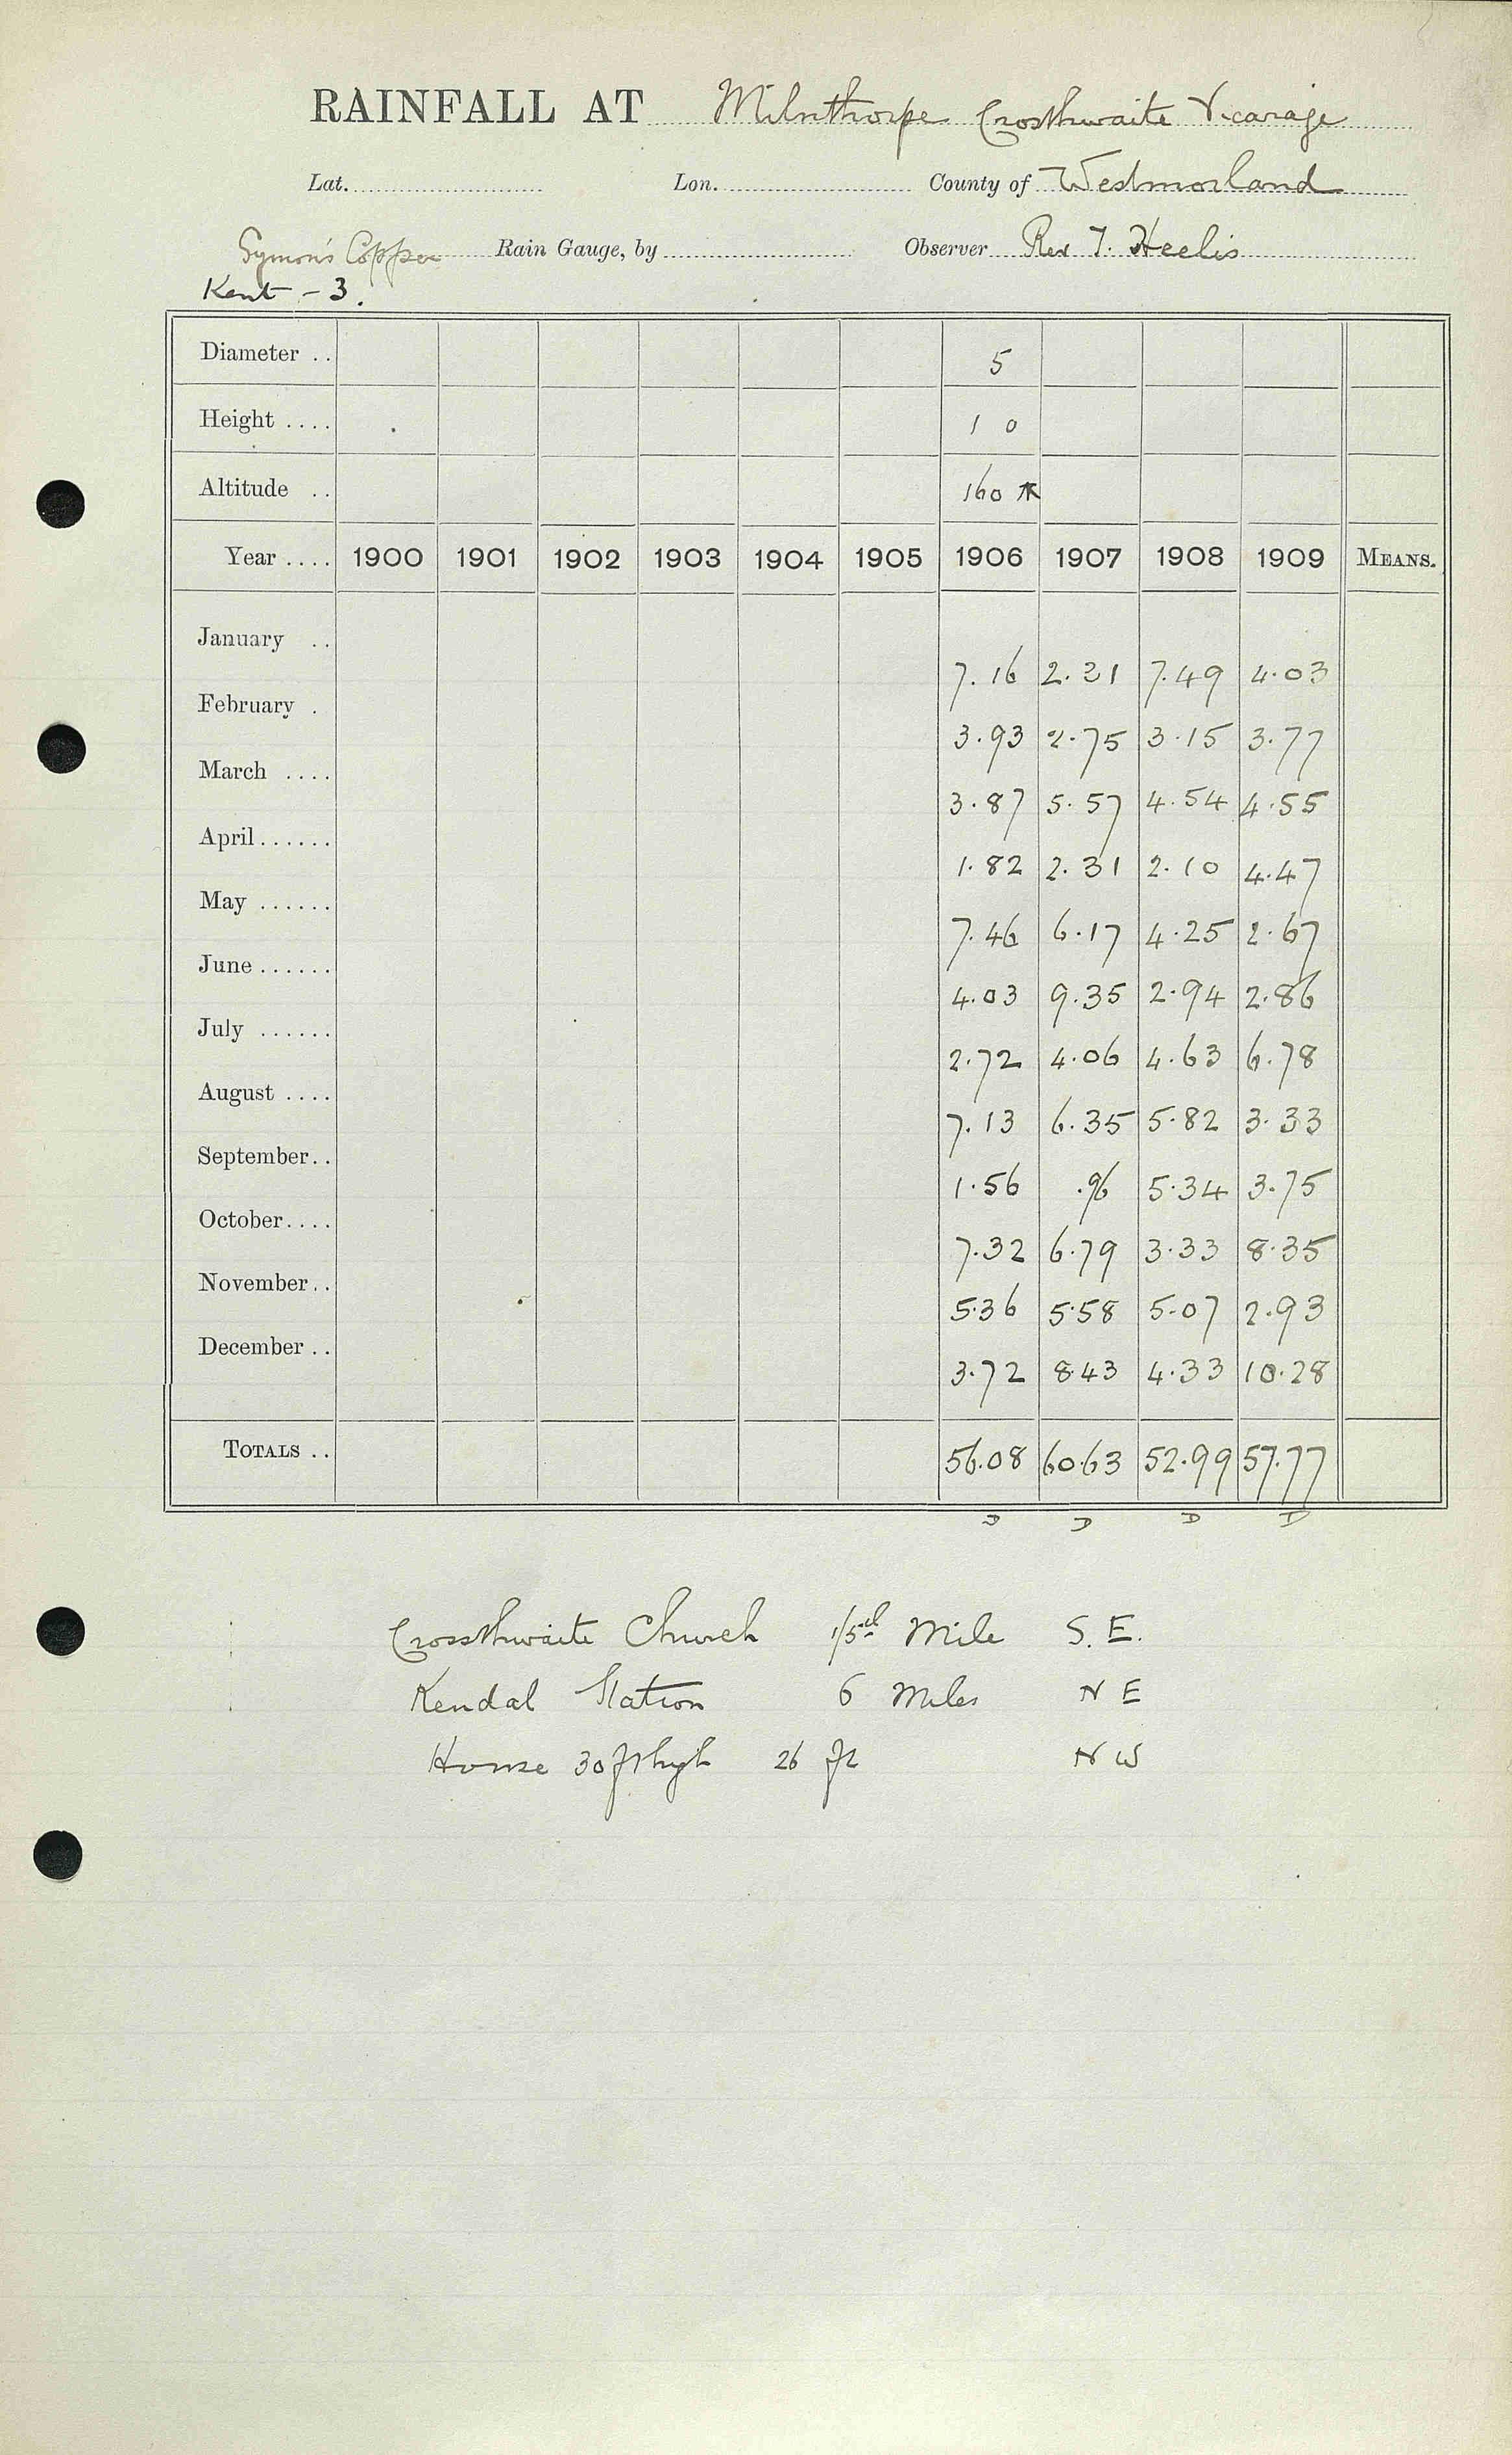
3 Vicarage 1906-09
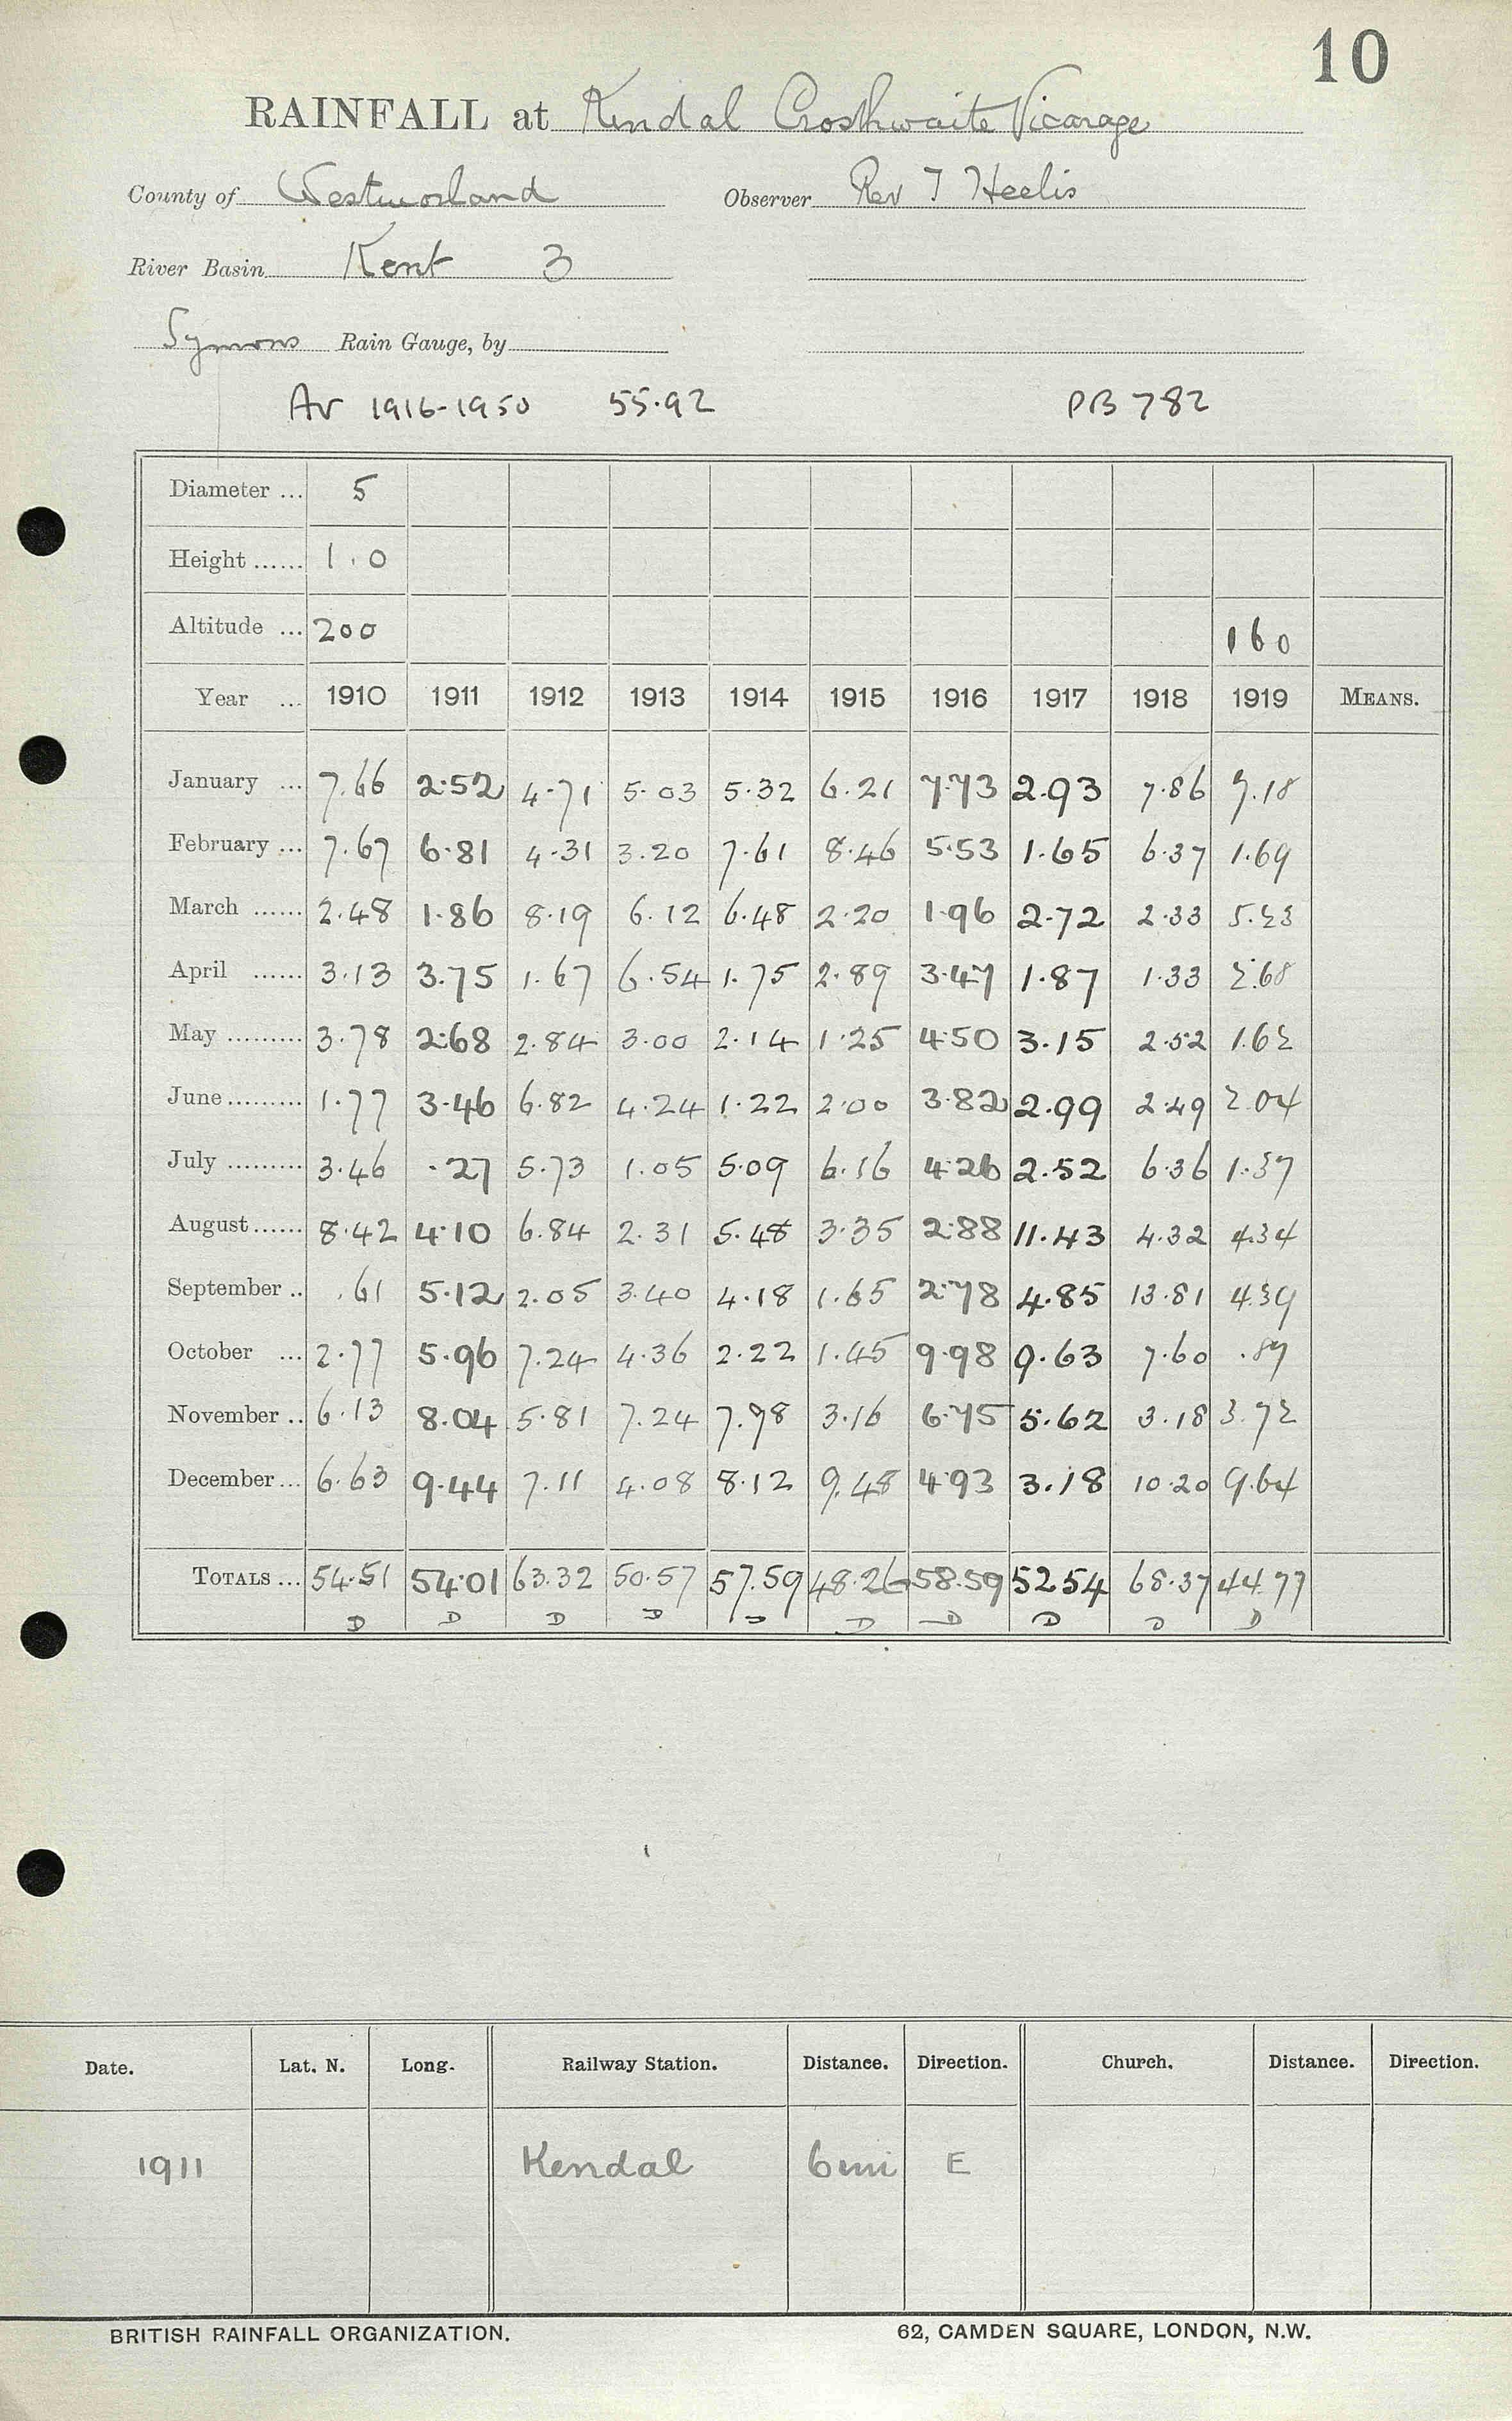
4 Vicarage 1910-19
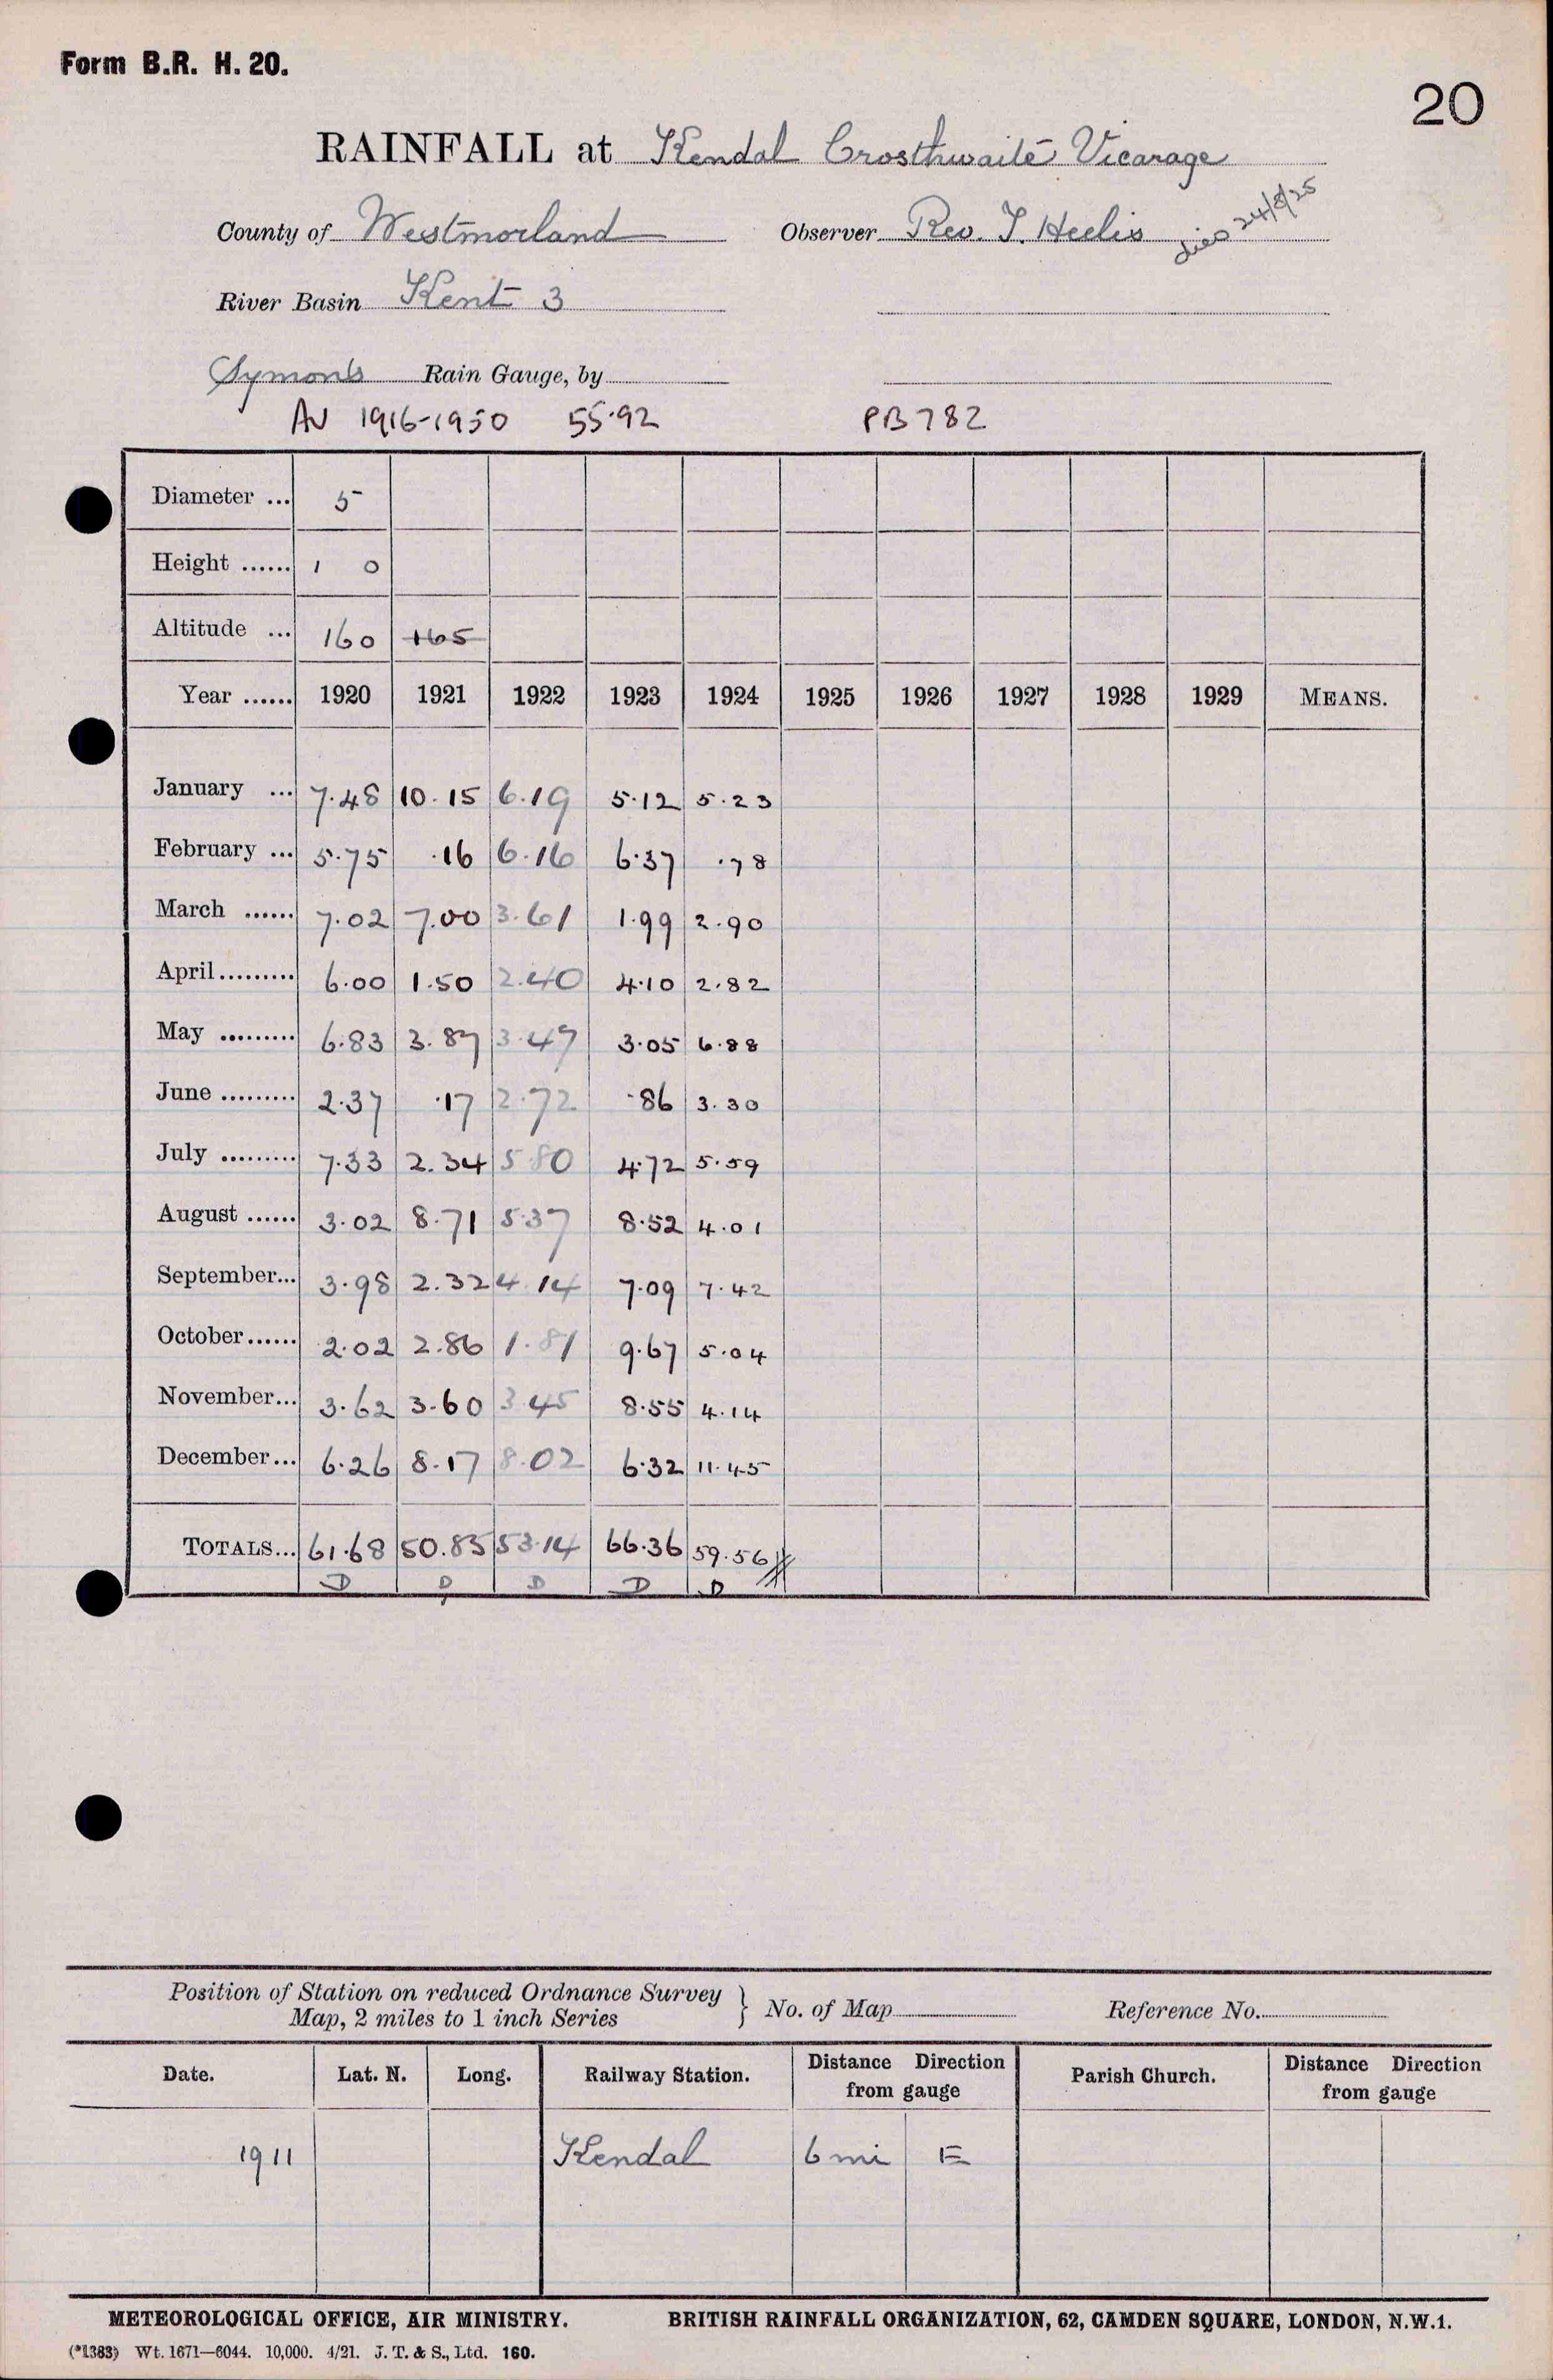
5 Vicarage 1920-24
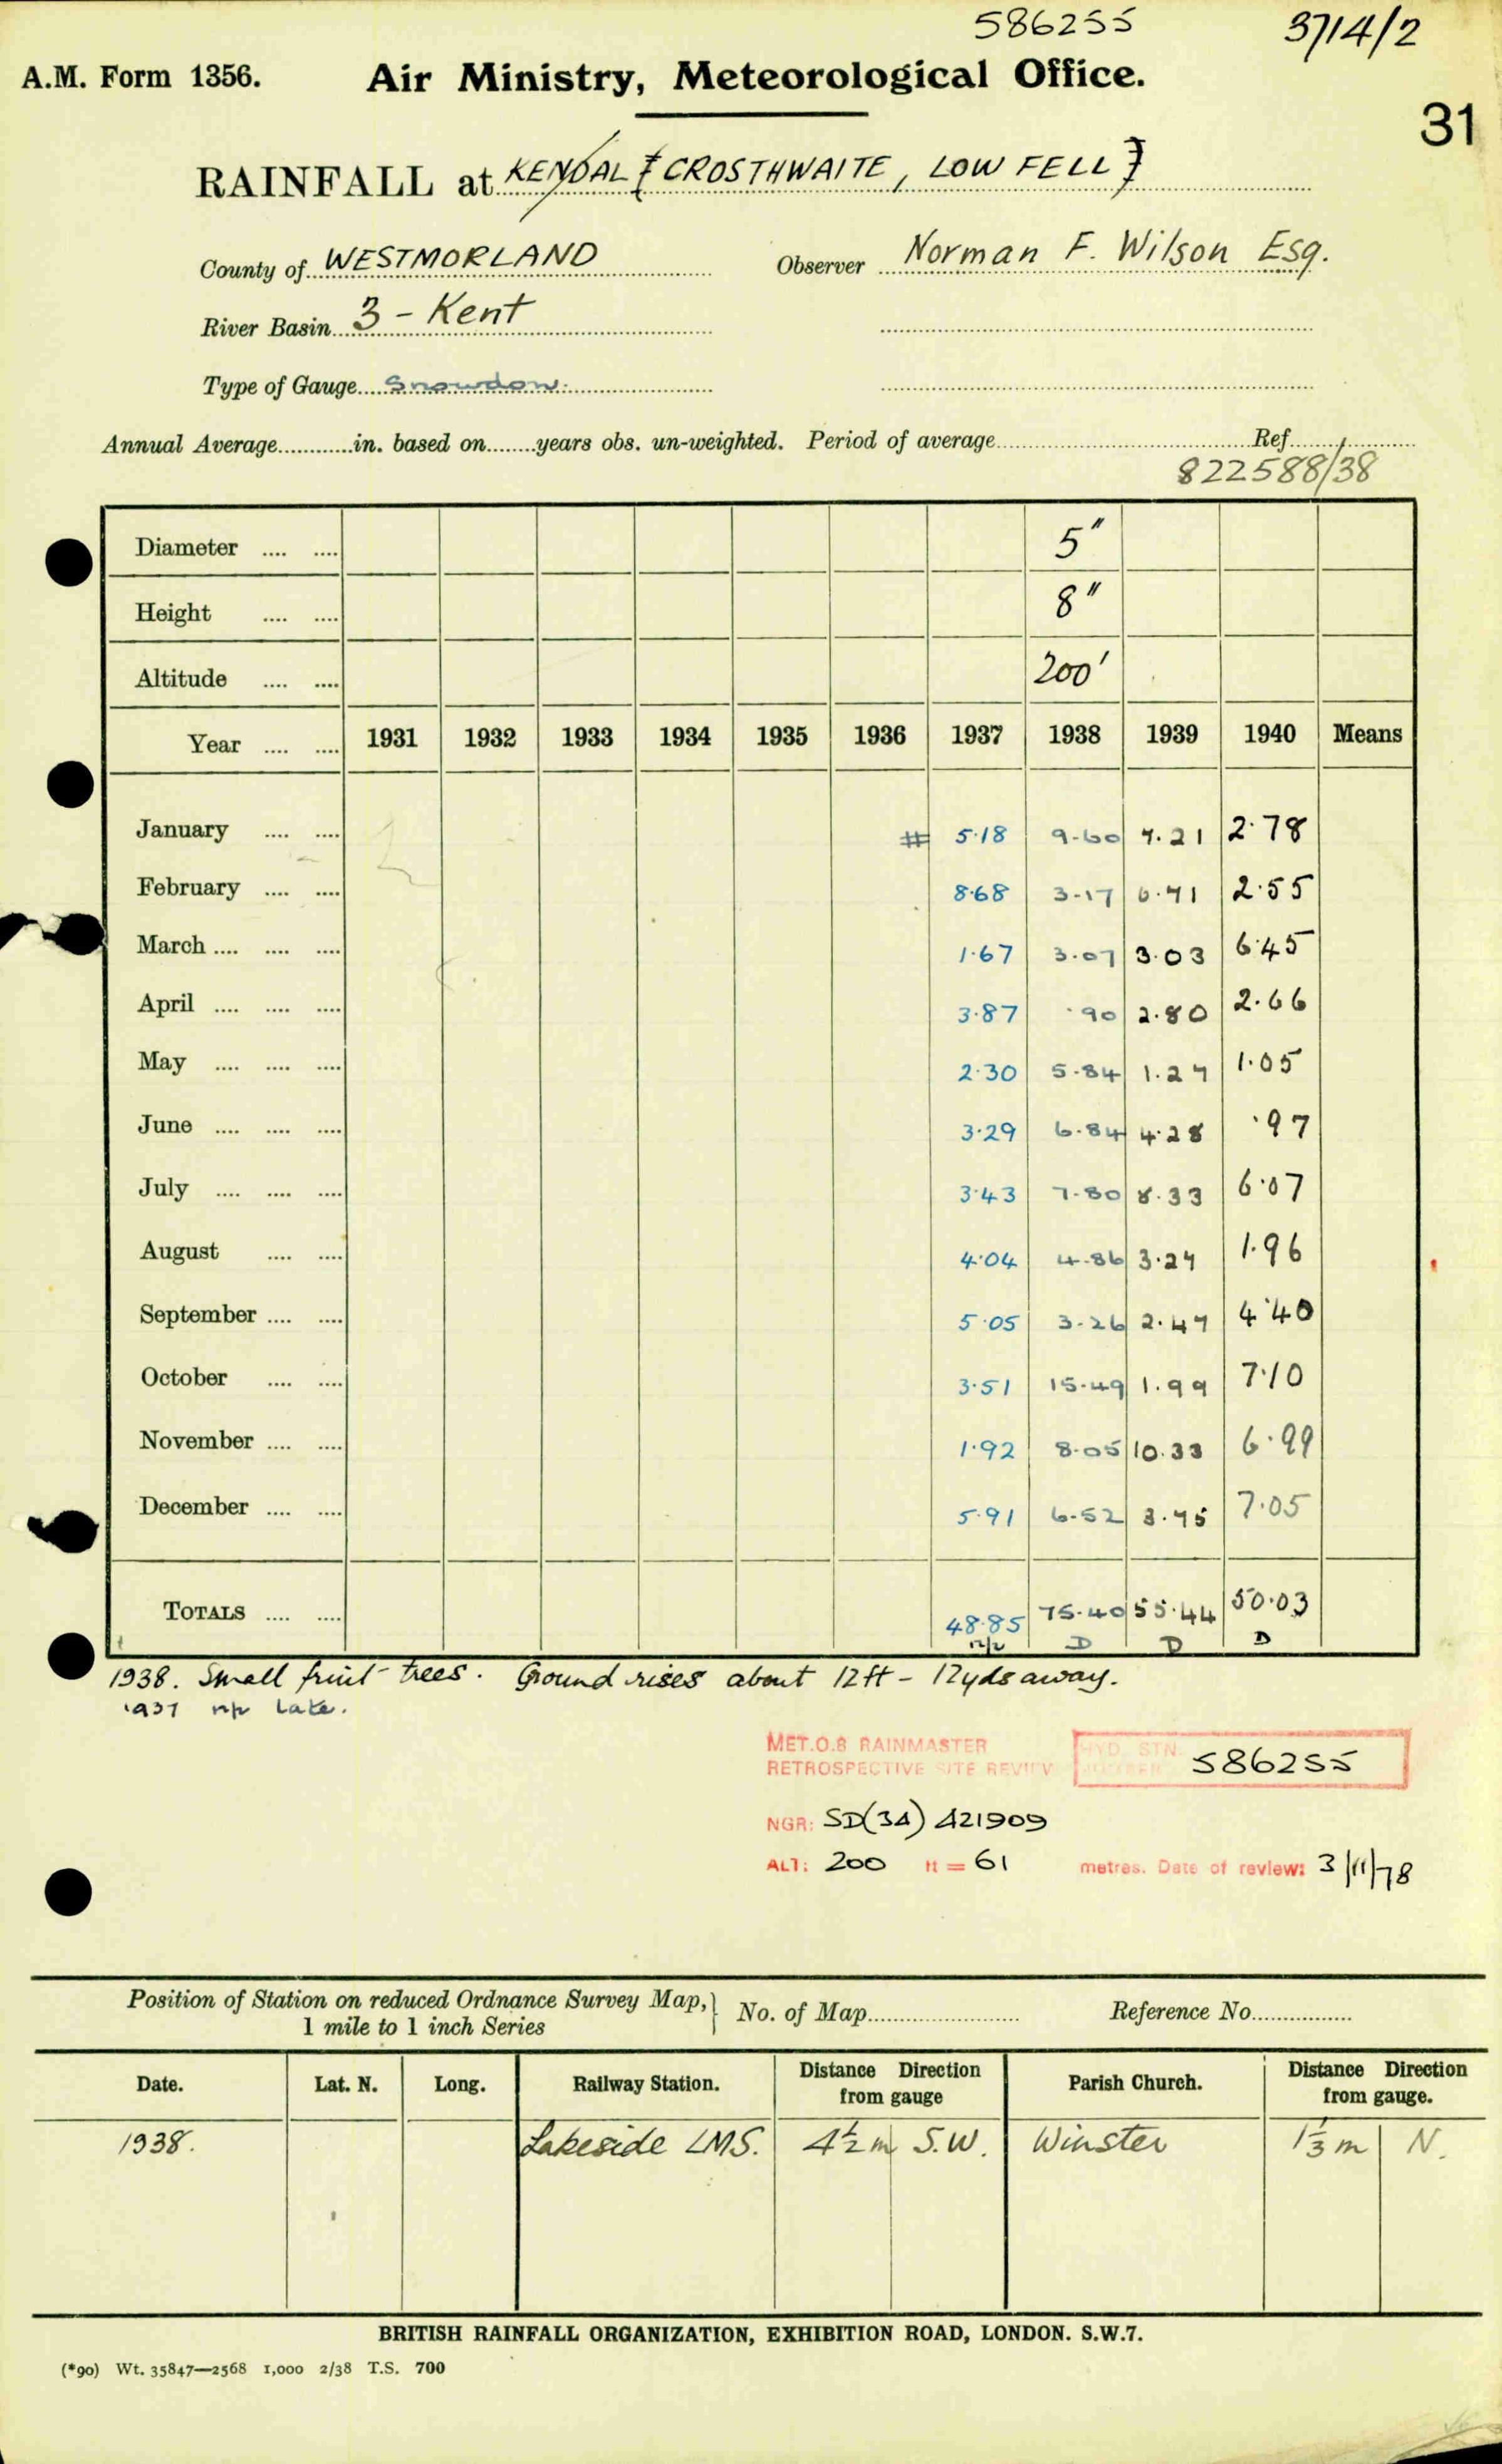
6 Low Fell 1937-40

7 Low Fell 1941-47